22a. Participant Numbers

What to write

For each group, the numbers of participants who were randomly assigned, received intended intervention, and were analysed for the primary outcome

Examples

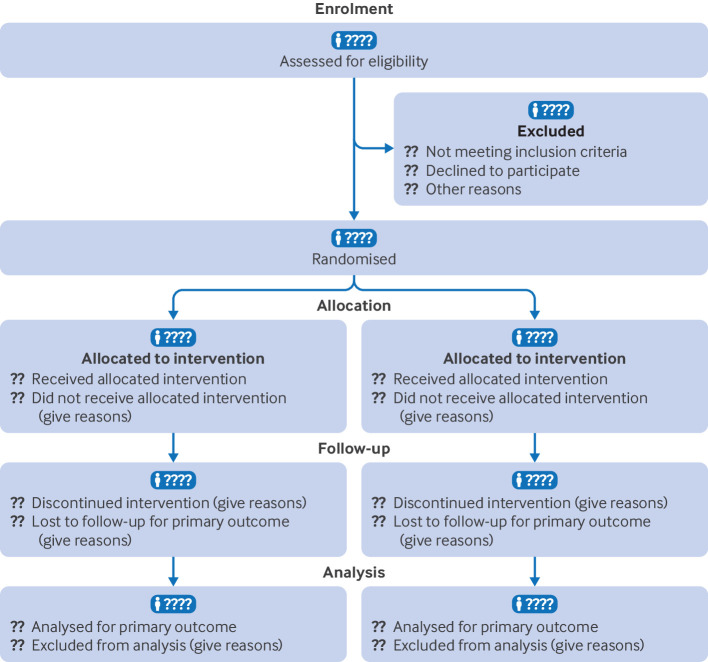
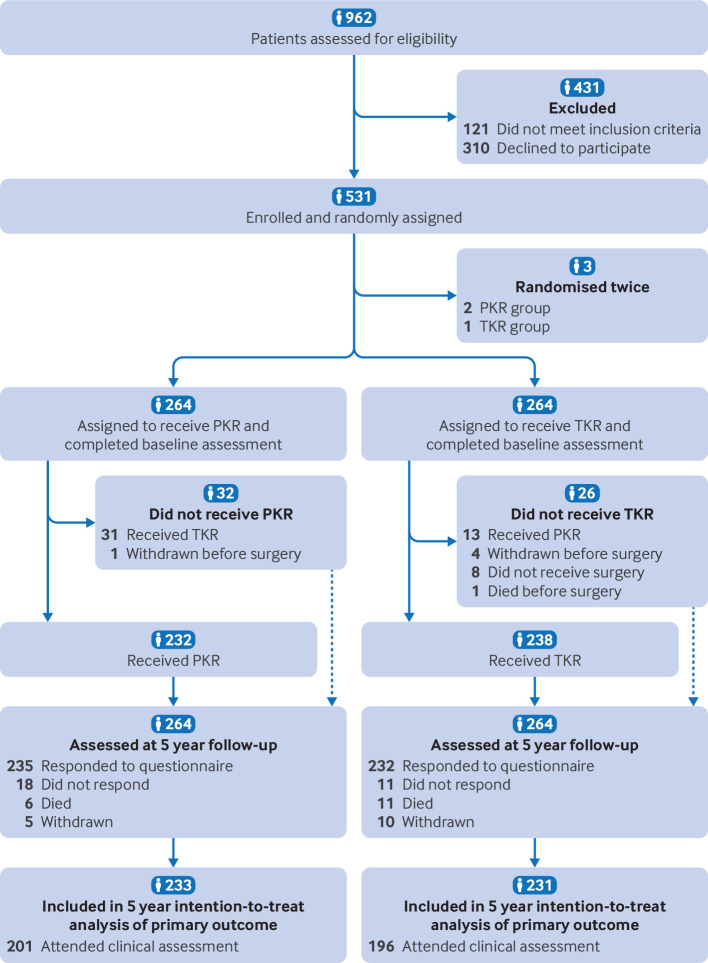
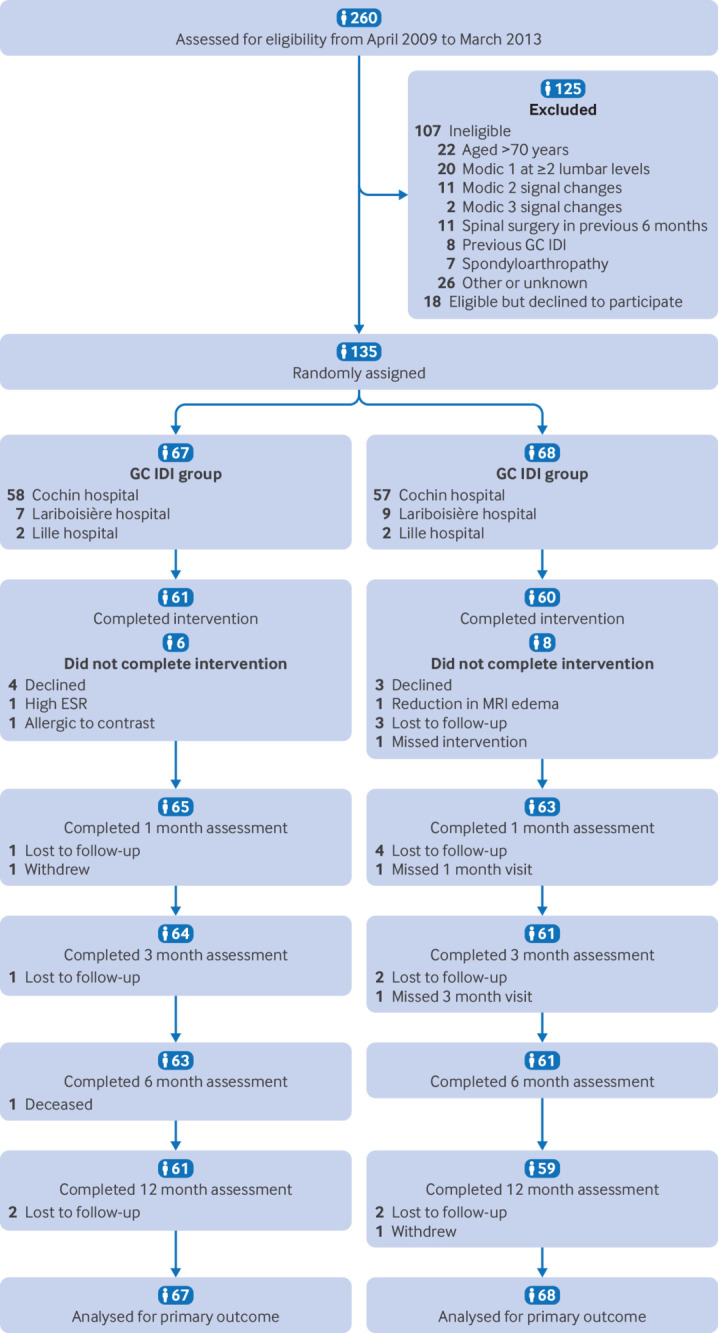
See Figure 1, Figure 2, and Figure 3.

Figure 1: CONSORT 2025 flow diagram. Flow diagram of participant progress through the phases of a two group, parallel randomised trial (ie, enrolment, intervention allocation, follow-up, and data analysis). CONSORT=Consolidated Standards of Reporting Trials
Figure 2: Flow diagram of a multicentre trial of total (TKR) versus partial (PKR) knee replacement.1
Figure 3: Flow diagram of a multicentre trial of glucocorticoid intradiscal injection in patients with chronic low back pain.2 ESR=erythrocyte sedimentation rate; GC IDI=glucocorticoid intradiscal injection; MRI=magnetic resonance imaging

Explanation

The design and conduct of some randomised trials are straightforward, and the flow of participants, particularly where there are no losses to follow-up or exclusions, through each phase of the study can be described relatively easily. For other trials, it can be difficult for readers to discern whether and why some participants did not receive the treatment as allocated, were lost to follow-up, or were excluded from the analysis.3 This information is crucial for several reasons. Participants who were excluded after allocation are unlikely to be representative of all participants in the study. For example, participants may not be available for follow-up evaluation because they experienced an acute exacerbation of their illness or harms of treatment.4,5

Attrition as a result of loss to follow-up, which is often unavoidable, needs to be distinguished from investigator-determined exclusion for such reasons as ineligibility, withdrawal from treatment, and poor adherence to the trial protocol. Erroneous conclusions can be reached if participants are excluded from analysis, and imbalances in such omissions between groups may be especially indicative of bias.56,7 Information about whether the investigators included in the analysis all participants who underwent randomisation, in the groups to which they were originally allocated (item 21b), is therefore of particular importance. Knowing the number of participants who did not receive the intervention as allocated or did not complete treatment permits the reader to assess to what extent the estimated efficacy of therapy might be underestimated in comparison with ideal circumstances.

If available, the number of people assessed for eligibility, and reason for exclusion, should also be reported. Although this number is relevant to external validity only and is arguably less important than the other counts,8 it is a useful indicator of whether trial participants were likely to be representative of all eligible participants.

A suggested template for reporting the number of participants who were randomly assigned, received intended treatment, were lost to follow-up, and were analysed for the primary outcome is shown in figure 1, and the counts required are described in detail in Table 1. A review of randomised trials published in general medical journals found that reporting of what happened to participants and their data was considerably more thorough in articles that included a diagram of the flow of participants through a trial than in those that did not.3

Table 1: Information required to document the flow of participants through each stage of a randomised trial for the primary outcome
Stage No of people included No of people not included or excluded Rationale
Enrolment People evaluated for potential enrolment People who did not meet the inclusion criteria or met the inclusion criteria but declined to be enrolled These counts indicate whether trial participants were likely to be representative of all patients seen; they are relevant to assessment of external validity only, and they are often not available
Randomisation Participants randomly assigned — Cr ucial count for defining trial size and assessing whether a trial has been analysed by intention-to-treat
Treatment allocation Participants who received intervention as allocated, by trial group Participants who did not receive intervention as allocated, by trial group Important counts for assessment of internal validity and interpretation of results; reasons for not receiving intervention as allocated should be given
Follow-up Participants who completed intervention as allocated, by trial group
Participants who completed follow-up as planned, by trial group
Participants who did not complete intervention as allocated, by trial group
Participants who did not complete follow-up as planned, by trial group
Important counts for assessment of internal validity and interpretation of results; reasons for not completing intervention or follow-up should be given
Analysis Participants included in main analysis for the primary outcome, by trial group Participants excluded from main analysis for the primary outcome, by trial group Crucial count for assessing whether a trial has been analysed by intention-to-treat; reasons for excluding participants should be given

Some information, such as the number of individuals assessed for eligibility, may not always be known,9 and depending on the nature of a trial, some counts may be more relevant than others. It will sometimes be useful or necessary to adapt the structure of the flow diagram to a particular trial. In some situations, other information may usefully be added. For example, for trials of non-pharmacological interventions it may be important to report the number of care providers or centres performing the intervention in each group and the number of participants treated by each care provider or in each centre.10

The exact form and content of the flow diagram may be varied according to specific features of a trial. For example, many trials of surgery or vaccination do not include the possibility of discontinuation. Although CONSORT strongly recommends using a flow diagram to communicate participant flow throughout the study, there is no specific, prescribed format.

Training

The UK EQUATOR Centre runs training on how to write using reporting guidelines.

Discuss this item

Visit this items’ discussion page to ask questions and give feedback.

References

1.
Beard DJ, Davies LJ, Cook JA, et al. The clinical and cost-effectiveness of total versus partial knee replacement in patients with medial compartment osteoarthritis (TOPKAT): 5-year outcomes of a randomised controlled trial. The Lancet. 2019;394(10200):746-756. doi:10.1016/s0140-6736(19)31281-4
2.
Nguyen C, Boutron I, Baron G, et al. Intradiscal glucocorticoid injection for patients with chronic low back pain associated with active discopathy: A randomized trial. Annals of Internal Medicine. 2017;166(8):547-556. doi:10.7326/m16-1700
3.
Egger M. Value of flow diagrams in reports of randomized controlled trials. JAMA. 2001;285(15):1996. doi:10.1001/jama.285.15.1996
4.
Altman DG. Randomisation. BMJ. 1991;302(6791):1481-1482. doi:10.1136/bmj.302.6791.1481
5.
Sackett DL, Gent M. Controversy in counting and attributing events in clinical trials. New England Journal of Medicine. 1979;301(26):1410-1412. doi:10.1056/nejm197912273012602
6.
May GS, DeMets DL, Friedman LM, Furberg C, Passamani E. The randomized clinical trial: Bias in analysis. Circulation. 1981;64(4):669-673. doi:10.1161/01.cir.64.4.669
7.
New England Journal of Medicine. 1994;330(24):1758-1759. doi:10.1056/nejm199406163302415
8.
Meinert CL. Beyond CONSORT: Need for improved reporting standards for clinical trials. JAMA. 1998;279(18):1487. doi:10.1001/jama.279.18.1487
9.
Pocock SJ, Hughes MD, Lee RJ. Statistical problems in the reporting of clinical trials. New England Journal of Medicine. 1987;317(7):426-432. doi:10.1056/nejm198708133170706
10.
Boutron I, Altman DG, Moher D, Schulz KF, Ravaud P. CONSORT statement for randomized trials of nonpharmacologic treatments: A 2017 update and a CONSORT extension for nonpharmacologic trial abstracts. Annals of Internal Medicine. 2017;167(1):40-47. doi:10.7326/m17-0046

Reuse

Most of the reporting guidelines and checklists on this website were originally published under permissive licenses that allowed their reuse. Some were published with propriety licenses, where copyright is held by the publisher and/or original authors. The original content of the reporting checklists and explanation pages on this website were drawn from these publications with knowledge and permission from the reporting guideline authors, and subsequently revised in response to feedback and evidence from research as part of an ongoing scholarly dialogue about how best to disseminate reporting guidance. The UK EQUATOR Centre makes no copyright claims over reporting guideline content. Our use of copyrighted content on this website falls under fair use guidelines.

Citation

For attribution, please cite this work as:
Hopewell S, Chan AW, Collins GS, et al. CONSORT 2025 statement: updated guideline for reporting randomised trials. BMJ. 2025;389:e081123. doi:10.1136/bmj-2024-081123

Reporting Guidelines are recommendations to help describe your work clearly

Your research will be used by people from different disciplines and backgrounds for decades to come. Reporting guidelines list the information you should describe so that everyone can understand, replicate, and synthesise your work.

Reporting guidelines do not prescribe how research should be designed or conducted. Rather, they help authors transparently describe what they did, why they did it, and what they found.

Reporting guidelines make writing research easier, and transparent research leads to better patient outcomes.

Easier writing

Following guidance makes writing easier and quicker.

Smoother publishing

Many journals require completed reporting checklists at submission.

Maximum impact

From nobel prizes to null results, articles have more impact when everyone can use them.

Who reads research?

You work will be read by different people, for different reasons, around the world, and for decades to come. Reporting guidelines help you consider all of your potential audiences. For example, your research may be read by researchers from different fields, by clinicians, patients, evidence synthesisers, peer reviewers, or editors. Your readers will need information to understand, to replicate, apply, appraise, synthesise, and use your work.

Cohort studies

A cohort study is an observational study in which a group of people with a particular exposure (e.g. a putative risk factor or protective factor) and a group of people without this exposure are followed over time. The outcomes of the people in the exposed group are compared to the outcomes of the people in the unexposed group to see if the exposure is associated with particular outcomes (e.g. getting cancer or length of life).

Source.

Case-control studies

A case-control study is a research method used in healthcare to investigate potential risk factors for a specific disease. It involves comparing individuals who have been diagnosed with the disease (cases) to those who have not (controls). By analysing the differences between the two groups, researchers can identify factors that may contribute to the development of the disease.

An example would be when researchers conducted a case-control study examining whether exposure to diesel exhaust particles increases the risk of respiratory disease in underground miners. Cases included miners diagnosed with respiratory disease, while controls were miners without respiratory disease. Participants' past occupational exposures to diesel exhaust particles were evaluated to compare exposure rates between cases and controls.

Source.

Cross-sectional studies

A cross-sectional study (also sometimes called a "cross-sectional survey") serves as an observational tool, where researchers capture data from a cohort of participants at a singular point. This approach provides a 'snapshot'— a brief glimpse into the characteristics or outcomes prevalent within a designated population at that precise point in time. The primary aim here is not to track changes or developments over an extended period but to assess and quantify the current situation regarding specific variables or conditions. Such a methodology is instrumental in identifying patterns or correlations among various factors within the population, providing a basis for further, more detailed investigation.

Source

Systematic reviews

A systematic review is a comprehensive approach designed to identify, evaluate, and synthesise all available evidence relevant to a specific research question. In essence, it collects all possible studies related to a given topic and design, and reviews and analyses their results.

The process involves a highly sensitive search strategy to ensure that as much pertinent information as possible is gathered. Once collected, this evidence is often critically appraised to assess its quality and relevance, ensuring that conclusions drawn are based on robust data. Systematic reviews often involve defining inclusion and exclusion criteria, which help to focus the analysis on the most relevant studies, ultimately synthesising the findings into a coherent narrative or statistical synthesis. Some systematic reviews will include a [meta-analysis]{.defined data-bs-toggle="offcanvas" href="#glossaryItemmeta_analyses" aria-controls="offcanvasExample" role="button"}.

Source

Systematic review protocols

TODO

Meta analyses of Observational Studies

TODO

Randomised Trials

A randomised controlled trial (RCT) is a trial in which participants are randomly assigned to one of two or more groups: the experimental group or groups receive the intervention or interventions being tested; the comparison group (control group) receive usual care or no treatment or a placebo. The groups are then followed up to see if there are any differences between the results. This helps in assessing the effectiveness of the intervention.

Source

Randomised Trial Protocols

TODO

Qualitative research

Research that aims to gather and analyse non-numerical (descriptive) data in order to gain an understanding of individuals' social reality, including understanding their attitudes, beliefs, and motivation. This type of research typically involves in-depth interviews, focus groups, or field observations in order to collect data that is rich in detail and context. Qualitative research is often used to explore complex phenomena or to gain insight into people's experiences and perspectives on a particular topic. It is particularly useful when researchers want to understand the meaning that people attach to their experiences or when they want to uncover the underlying reasons for people's behaviour. Qualitative methods include ethnography, grounded theory, discourse analysis, and interpretative phenomenological analysis.

Source

Case Reports

TODO

Diagnostic Test Accuracy Studies

Diagnostic accuracy studies focus on estimating the ability of the test(s) to correctly identify people with a predefined target condition, or the condition of interest (sensitivity) as well as to clearly identify those without the condition (specificity).

Prediction Models

Prediction model research is used to test the accurarcy of a model or test in estimating an outcome value or risk. Most models estimate the probability of the presence of a particular health condition (diagnostic) or whether a particular outcome will occur in the future (prognostic). Prediction models are used to support clinical decision making, such as whether to refer patients for further testing, monitor disease deterioration or treatment effects, or initiate treatment or lifestyle changes. Examples of well known prediction models include EuroSCORE II for cardiac surgery, the Gail model for breast cancer, the Framingham risk score for cardiovascular disease, IMPACT for traumatic brain injury, and FRAX for osteoporotic and hip fractures.

Source

Animal Research

TODO

Quality Improvement in Healthcare

Quality improvement research is about finding out how to improve and make changes in the most effective way. It is about systematically and rigourously exploring "what works" to improve quality in healthcare and the best ways to measure and disseminate this to ensure positive change. Most quality improvement effectiveness research is conducted in hospital settings, is focused on multiple quality improvement interventions, and uses process measures as outcomes. There is a great deal of variation in the research designs used to examine quality improvement effectiveness.

Source

Economic Evaluations in Healthcare

TODO

Meta Analyses

A meta-analysis is a statistical technique that amalgamates data from multiple studies to yield a single estimate of the effect size. This approach enhances precision and offers a more comprehensive understanding by integrating quantitative findings. Central to a meta-analysis is the evaluation of heterogeneity, which examines variations in study outcomes to ensure that differences in populations, interventions, or methodologies do not skew results. Techniques such as meta-regression or subgroup analysis are frequently employed to explore how various factors might influence the outcomes. This method is particularly effective when aiming to quantify the effect size, odds ratio, or risk ratio, providing a clearer numerical estimate that can significantly inform clinical or policy decisions.

How Meta-analyses and Systematic Reviews Work Together

Systematic reviews and meta-analyses function together, each complementing the other to provide a more robust understanding of research evidence. A systematic review meticulously gathers and evaluates all pertinent studies, establishing a solid foundation of qualitative and quantitative data. Within this framework, if the collected data exhibit sufficient homogeneity, a meta-analysis can be performed. This statistical synthesis allows for the integration of quantitative results from individual studies, producing a unified estimate of effect size. Techniques such as meta-regression or subgroup analysis may further refine these findings, elucidating how different variables impact the overall outcome. By combining these methodologies, researchers can achieve both a comprehensive narrative synthesis and a precise quantitative measure, enhancing the reliability and applicability of their conclusions. This integrated approach ensures that the findings are not only well-rounded but also statistically robust, providing greater confidence in the evidence base.

Why Don't All Systematic Reviews Use a Meta-Analysis?

Systematic reviews do not always have meta-analyses, due to variations in the data. For a meta-analysis to be viable, the data from different studies must be sufficiently similar, or homogeneous, in terms of design, population, and interventions. When the data shows significant heterogeneity, meaning there are considerable differences among the studies, combining them could lead to skewed or misleading conclusions. Furthermore, the quality of the included studies is critical; if the studies are of low methodological quality, merging their results could obscure true effects rather than explain them.

Protocol

A plan or set of steps that defines how something will be done. Before carrying out a research study, for example, the research protocol sets out what question is to be answered and how information will be collected and analysed.

Source

Asdfghj

sdfghjk