What to write
Initial steps of the intervention(s) and their evolution over time (eg, timeline diagram, flow chart or table), including modifications made to the intervention during the project
Details of the process measures and outcome
Explanation
Healthcare improvement work is based on a rationale, or hypothesis, as to what intervention will have the desired outcome(s) in a given context. Over time, as a result of the interaction between interventions and context, these hypotheses are re-evaluated, resulting in modifications or changes to the interventions. Although the mechanism by which this occurs should be included in the methods section of a report, the resulting transformation of the intervention over time rightfully belongs under results. The results section should therefore describe both this evolution and its associated outcomes.
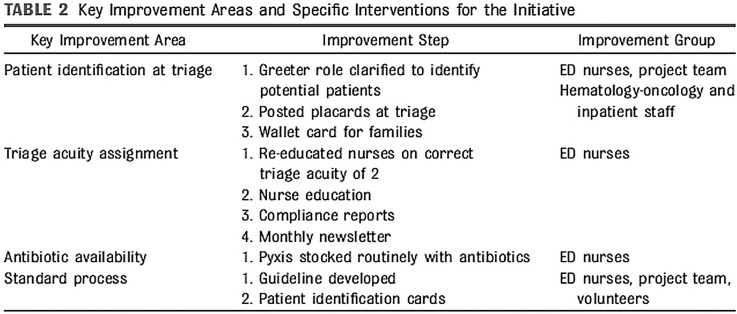
When publishing this work, it is important that the reader has specific information about the initial interventions and how they evolved. This can be in the form of tables and figures in addition to text. In the example below, interventions are described in phases: I, II, III and a sustainability phase, and information provided as to why they evolved and how various roles were impacted (Figure 2). This level of detail allows readers to imagine how these interventions and staff roles might be adapted in the context of their own institutions, as an intervention which is successful in one organisation may not be in another.
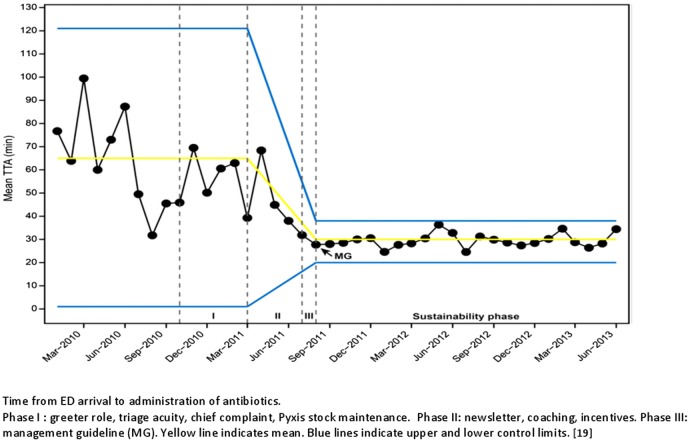
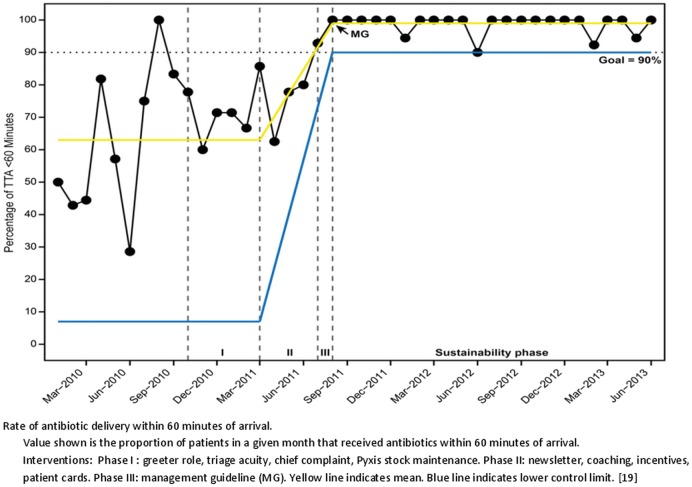
It is important to report the degree of success achieved in implementing an intervention in order to assess its fidelity, for example, the proportion of the time that the intervention actually occurred as intended. In the example below, the goal of delivering antibiotics within an hour of arrival, a process measure, is expressed in terms of the percentage of total patients for whom it was achieved. The first chart (Figure 3) shows the sustained improvement in this measure over time. The second chart (Figure 1) illustrates the resulting decrease in variation as the interventions evolved and took hold. The charts are annotated to show the phases of evolution of the project, to enable readers to see where each intervention fits in relationship to project results over time.
Example
Over the course of this initiative, 479 patient encounters that met criteria took place. TTA(Time to antibiotic) delivery was tracked, and the percentage of patients receiving antibiotics within 60 minutes of arrival increased from 63% to 99% after 8 months, exceeding our goal of 90% … Control charts demonstrated that antibiotic administration was reliably, 1 hour by phase III and has been sustained for 24 months since our initiative goal was first met in June 2011.
Key improvement areas and specific interventions for the initiative are listed in Figure 2. During phase I, the existing processes for identifying and managing febrile patients with central lines were mapped and analyzed. Key interventions that were tested and implemented included revision of the greeter role to include identification of patients with central lines presenting with fever and notification of the triage nurse, designation of chief complaint as “fever/central line,” re-education and re-emphasis of triage acuity as 2 for these patients, and routine stocking of the Pyxis machine ….
In phase II, strategies focused on improving performance by providing data and other information for learning, using a monthly newsletter, public sharing of aggregate compliance data tracking, individual reports of personal performance, personal coaching of noncompliant staff, and rewards for compliance…
In phase III, a management guideline with key decision elements was developed and implemented (Figure 3). A new patient identification and initial management process was designed based on the steps, weaknesses, and challenges identified in the existing process map developed in phase I. This process benefited from feedback from frontline ED staff and the results of multiple PDSA cycles during phases I and II….
During the sustainability phase, data continued to be collected and reported to monitor ongoing performance and detect any performance declines should they occur…2
Training
The UK EQUATOR Centre runs training on how to write using reporting guidelines.
Discuss this item
Visit this items’ discussion page to ask questions and give feedback.